CASE STUDY: ACCESSIBLE EARTHQUAKES
Using research and color to solve accessibility problems for color blind and low vision users.
Background
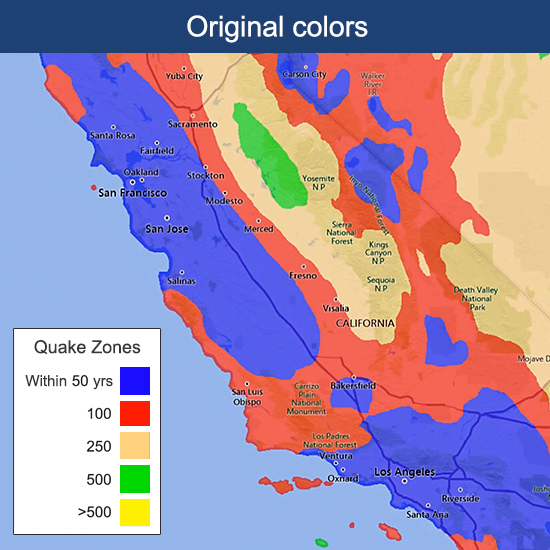
To ensure corporate risk insurance managers purchase the right amount of natural hazard coverage, my property insurance firm created detailed maps defining where disasters are more likely.
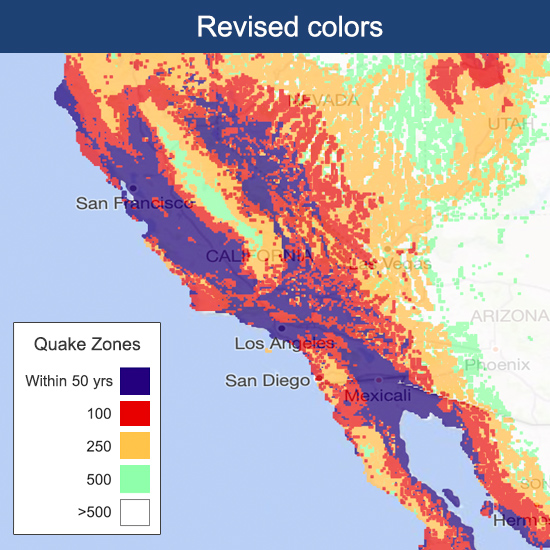
With earthquakes, bands of color were used to define zones where they are likely to happen within 50 to >500 year spans.
Challenge
During interviews, I learned color blind users were having trouble reading the maps. I recommended to the team that we revise the colors to make the maps more accessible.
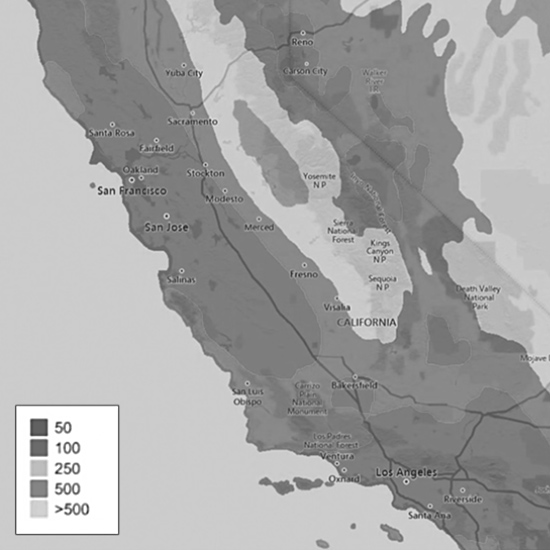
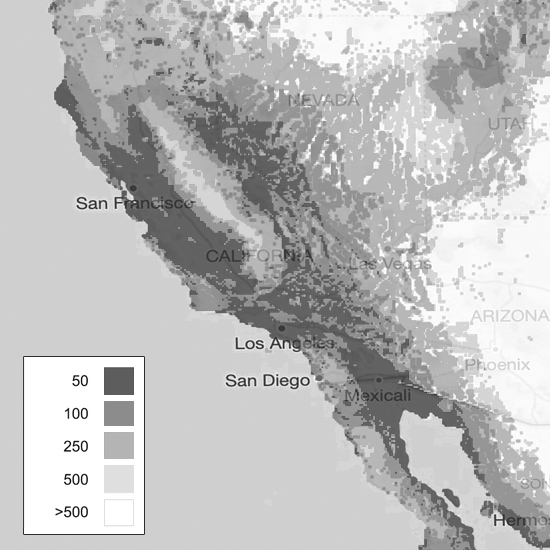
Utilizing software that simulated color blindness, I presented the problem to my team. Using California to illustrate the problem, it was shown that as colors shift, it becomes difficult for color blind users to understand how the zones relate to each other, and several of the zones start to blend together. This lack of contrast between zones would also impact low vision users who have difficulty seeing subtle tonal variations.
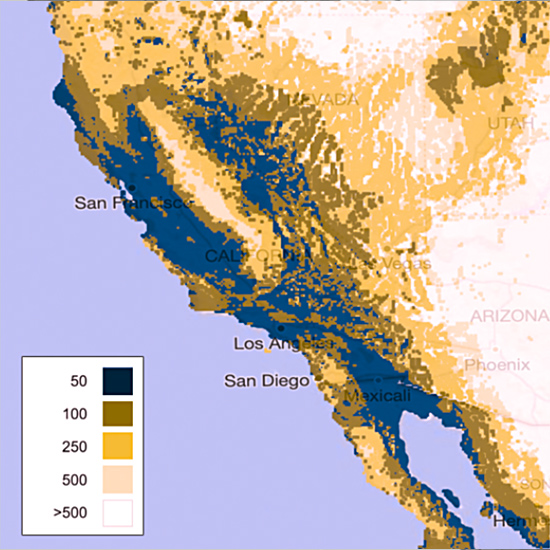
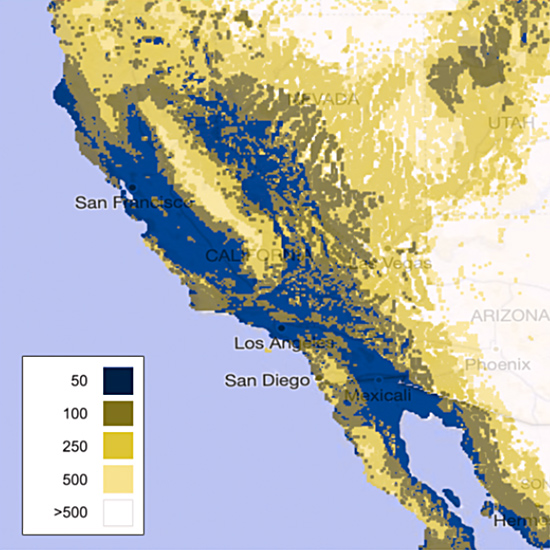
Maps as viewed by users with Deuteranopia, Protanopia and Monochromacy color blindness.
SOLUTION
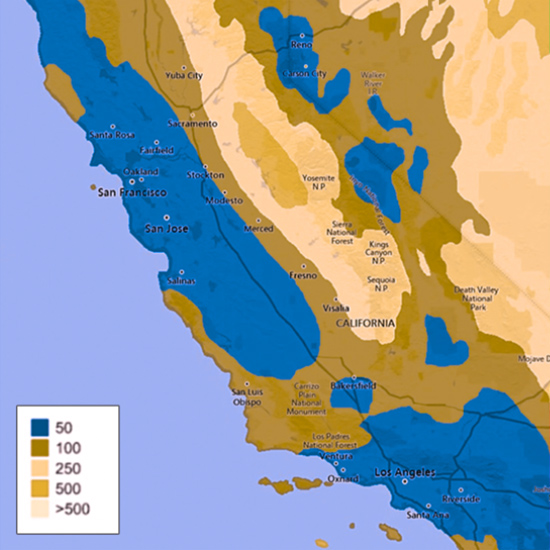
Though it was important to keep colors close to their original versions to support legacy users, I created a revised palette, calibrating color hue and value, that would be more accessible.
Revising the colors became even more crucial as the resolution of the maps was improved mid-project, adding finer detail and demanding clear delineation between zones.
To further assure the maps could be easily read, I suggested the areas of least risk were left without color.
RESOLUTION
When evaluated using the simulation software, the revised maps performed much better. Subsequent user testing confirmed that the adjusted colors improved overall accessibility.
Revised colors as seen by people with Deuteranopia, Protanopia and Monochromacy.
The updates to the maps were covered by Forbes in May, 2021.